유튜브에서 관련 영상을 보고 관심을 가지게된 7-Split 투자법! (책은 안봤다)
Kodex 레버리지에서도 괜찮은 성과가 나오지 않을까 싶어서 일단..백테스트를 만들어보았다..
결론은……….내가 뭘 잘못한건지 모르겠지만…테스트 기간이 5년이라 그런가..
생각보다 결과가 좋지는 않았다..
머리속으로 생각했을땐 꽤나 괜찮은거 같았는데………….
뭘 놓치고 있는지 모르겠다..ㅋㅋ
시간될때 코드를 다시 꼼꼼하게 봐야겠음!
import requests
import time
import datetime
import os
import csv
import pandas as pd
import yfinance as yf
import matplotlib.pyplot as plt


initMoney = 1000 * 10000

config = {
            1 : {"sell_rate" : 103 },
            2 : {"buy_rate" : 95, "sell_rate" : 105 },
            3 : {"buy_rate" : 94, "sell_rate" : 106 },
            4 : {"buy_rate" : 93, "sell_rate" : 107 },
            5 : {"buy_rate" : 92, "sell_rate" : 108 },
            6 : {"buy_rate" : 91, "sell_rate" : 109 },
            7 : {"buy_rate" : 90, "sell_rate" : 110 },
            # 8 : {"buy_rate" : 90, "sell_rate" : 110 },
            # 9 : {"buy_rate" : 90, "sell_rate" : 110 },
            # 10 : {"buy_rate" : 90, "sell_rate" : 110 },
         }

results = {}

ticker = yf.Ticker('122630.KS')         # KODEX LEVERAGE 200
df = ticker.history(period="5y")
df.drop(df.tail(1).index,inplace=True)

balance = initMoney
df['Balance'] = 0
print(df)


for i, row in df.iterrows() :
    #print(row)
    datestr    = i
    open_price = row["Open"]
    high_price = row["High"]
    low_price  = row["Low"]
    close_price = row["Close"]

    for idx in range(1, len(config) + 1) :
        if idx not in results :
            # not yet buy
            if idx == 1 :
                results[idx] = {"buy_price": close_price, "amount" : int( balance / (len(config) + 1 - idx) / close_price)}
                balance -= (results[idx]["buy_price"] * results[idx]["amount"])
            else :
                if (idx - 1) in results :
                    want_price = results[idx-1]["buy_price"] * config[idx]["buy_rate"] / 100
                    if low_price <  want_price:
                        results[idx] = {"buy_price": want_price, "amount" : int( balance / (len(config) + 1 - idx) / want_price)}
                        balance -= (results[idx]["buy_price"] * results[idx]["amount"])
                        break
        else :
            # already buy
            want_sell_price = results[idx]["buy_price"] * config[idx]["sell_rate"] / 100

            if high_price > want_sell_price :
                if idx == 1 :
                    # rebalance
                    results[idx]["amount"] = results[idx]["amount"] - 1
                    results[idx]["buy_price"] = want_sell_price
                    balance += want_sell_price
                else :
                    balance += (want_sell_price * results[idx]["amount"])
                    del results[idx]

    current_money = balance
    for idx in range(1, len(config) + 1) :
        if idx in results :
            current_money += (close_price * results[idx]["amount"])

    print(f"{datestr} : {current_money} / {balance}, close : {close_price}")
    print(results)

    # Update Balance Value
    df.at[i, 'Balance'] = current_money

fig,ax = plt.subplots()
# make a plot
ax.plot(df['Close'], color="red")
ax.set_xlabel("year", fontsize = 14)
ax.set_ylabel("Price",color="red",fontsize=14)

ax2=ax.twinx()
ax2.plot(df['Balance'],color="blue")
ax2.set_ylabel("Balance",color="blue",fontsize=14)

plt.show()

fig.savefig('graph.png', format='png', dpi=200, bbox_inches='tight')
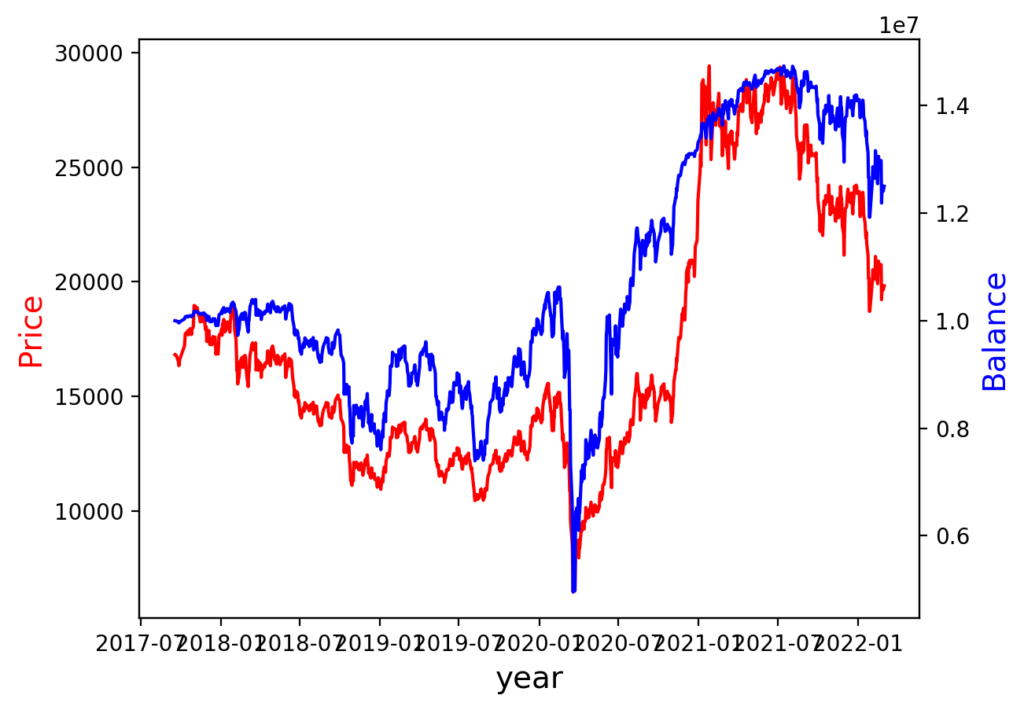
안정적으로 오르는 그래프를 기대했는데…. 그래프 흐름이 그냥 사놓고 있는것보다 크게 차이가 없어서 좀 아쉽다. 수익률은 좀 낮아서 안정적인 우상향 그래프를 기대했는데..ㅠ
시간날때마다 조금 더 튜닝해봐야겠다! (개선의 여지가 얼마나 있을진 모르겠지만..)